Solar Stabilizes Grid During Recent Heat Waves, But Duck Curve Days Complicate Grid Management
Global temperatures have broken long-standing records over the last month. Local utility companies have been in constant contact with their customers, offering small hints about energy conservation. Extreme heat generally translates into high electricity demand, and that can lead to rolling blackouts or outages that leave thousands without electricity. In the New England regional area, however, the power grid “hummed along uneventfully,” according to the Boston Globe.
Why? Thousands of solar panels on rooftops, over parking lots, and along highways have filled in energy gaps. Such small solar arrays distributed across the region create stability. “If one of these solar arrays goes down, it’ll be immaterial,” notes Joe LaRusso, manager of the Clean Grid Initiative at the Acadia Center.
Looking ahead, there’s more good news on the renewables front: the development of additional renewable resources such as wind and hydro-electric power will further reduce dependence on fossil fuels when electricity demand spikes due to heat waves and other stimuli.
 Chip in a few dollars a month to help support independent cleantech coverage that helps to accelerate the cleantech revolution!
Over 170,000 Massachusetts homes and businesses use solar, which boosts their viability during extreme weather and reduces grid burden when there is high demand for electricity. Solar is helping to fulfill local energy needs, and it’s creating a domino effect. Solar panels are becoming more affordable each year, the grid is more reliable with the addition of solar, and renewables are proving to be effective replacements for fossil fuel power.
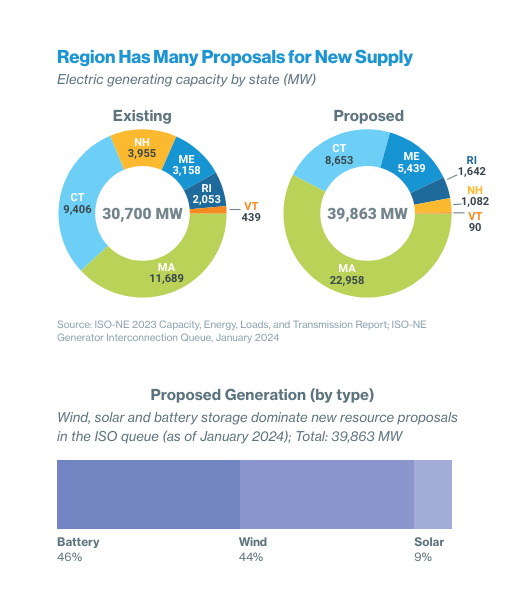
ISO- New England, an independent, not-for-profit corporation that ensures that the New England region has reliable, competitively priced wholesale electricity, estimates that the amount of solar on the grid will nearly double in the next decade. Then again, they explain such success will be dependent on a framework with 4 different pillars.
- Clean Energy: Significant amounts of clean energy to power the economy with a greener grid.
- Balancing Resources: Resources that can supply electricity, reduce demand, or provide other services to maintain power system equilibrium.
- Energy Adequacy: A dependable energy supply chain and/or a robust energy reserve to manage through extended periods of severe weather or energy supply constraints.
- Robust Transmission: To integrate renewable resources and move clean energy to consumers across New England.
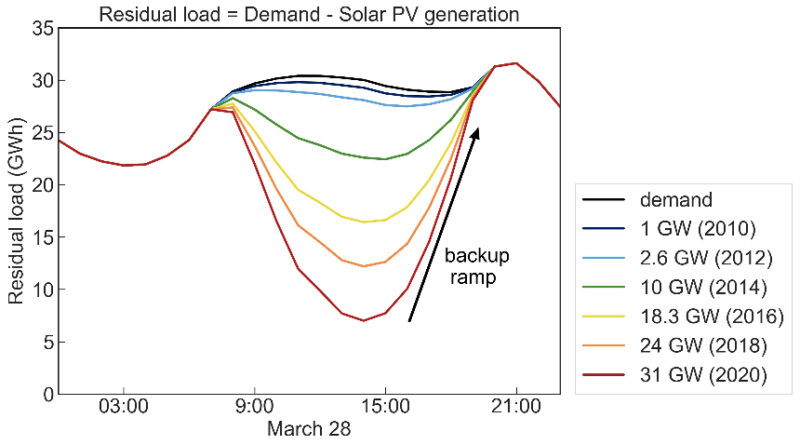
“It’s getting more and more and more every year,” Mike Knowland, manager of forecast and schedule for ISO New England. “As we add more solar to the system, the more duck curves we see.”
Yes, New England and many other regions will experience more “duck curve” days, a term which is an energy industry indicator for times in which solar provides so much energy that the supply of electricity needed from other sources dips lower during the daytime. Last year, there were 73 such days in the region, according to ISO-New England, up from 45 in 2022 and 18 in 2021. With annual additions of solar, more duck curves become common.
What’s so Important about the Duck Curve?
The duck curve refers to a disparity between peak demand and solar photovoltaic (PV) yield. It generally shows a distinct dip during daylight hours when the solar generation peaks, resembling a duck’s silhouette. The duck curve graphically depicts daily power production and reveals timing misalignment between peak energy demand and solar power generation. In other words, when graphed for a typical day, the pattern created by the midday dip in the net load curve, followed by a steep rise in the evenings when solar generation drops off, looks like the outline of a duck.
The onset of more and more solar power is reinforcing the premise that duck curve days can provide ample solar energy — to the point that the supply of electricity needed from other sources dips lower during the daytime. The problem emerges when a large volume of solar energy is disseminated in a supply grid. That excess can be the start of extreme variations in the load, resulting in a duck-form load arc that can cause stability issues.
Also, the cost of energy consumption is found to vary between the off-peak and peak loads observed in the duck-shaped load curve. Accurate load forecast and demand response programs are key tasks for duck curve management in a distribution structure.
California has been experiencing a duck curve dilemma. Grid operators at the California Independent System Operator (CAISO) have observed a drop in net load (or the demand remaining after subtracting variable renewable generation) in the middle of the day when solar generation tends to be highest. As solar capacity in California continues to grow, the midday dip in net load is getting lower, and grid operators have a very complex task before them, as they must constantly balance electricity generation with electricity demand in a region. The inconsistent nature of solar energy has grid operators looking for new ways to seamlessly integrate their output into the system.
A 2024 article in Energies outlines how the issue of duck curves in the power grid can be addressed by smoothing the power production of the PV systems, particularly during low-demand periods. PV systems are typically concentrated in specific areas where land costs are low and solar conditions are favorable. However, this concentration has led to a shortage of connection lines, resulting in waiting times for connections. This issue is a concern for business — it directly impacts profitability. Additionally, connections to the end of the power grid result in power quality issues, such as voltage spikes, owing to reverse flow.
The authors call for vertical and conventional PV systems to be combined for hosting capacity enhancement. Their study demonstrates that vertical PV systems exhibit a distinct peak power generation pattern that sets them apart from conventional PV systems. Unlike their counterparts, vertical PV systems have a lower peak output but can generate power during the morning and afternoon periods. In addition, the concentrated generation hours of conventional and vertical PV systems differ. By combining these systems, the overall power output of PV generation systems can be flattened.
Maintaining grid stability is a challenge as utilities rush to add renewable power to their generating portfolio. Another solution to account for the duck curve is to focus on energy storage so that the day’s solar energy is rerouted and stored in a battery. Then, when it is needed at sundown and into the evening hours, it can be gradually retrieved — simple and elegant. Looking well into this decade, experts in Spain expect the impact of the expected large photovoltaic deployment by 2030 to require storage capacity and/or backup reaching values of 5 GW per hour during 4 hours from afternoon through evening.
This scenario should be possible due to the massive technological advancements and efficiency in the battery storage and solar panel sectors, resulting in higher energy density batteries at a much lower price as production capacity of batteries continues to grow exponentially.
Have a tip for CleanTechnica? Want to advertise? Want to suggest a guest for our CleanTech Talk podcast? Contact us here.
Latest CleanTechnica.TV Videos

CleanTechnica uses affiliate links. See our policy here.