Estimating the Growth of Electric Vehicles & Tesla Sales, an Exploration of S-Curves
In this special report from CleanTechnica reader and data analyst David Gines, we get a high-quality, professional, useful exploration of exponential growth of EV sales — Tesla’s sales, Norway’s EV sales, and broader regional and global EV sales.
By David Gines, an electrical engineer specializing in algorithms for data analysis
How fast will the world transition to electric vehicles (EVs)? No one knows for sure, but we all have opinions. Many are now saying that EV growth has stalled. Others acknowledge growth, but imagine that it’s linear (increasing by a fixed amount each year), when in fact it’s exponential (increasing by a fixed percentage each year). Over-zealous advocates, on the other hand, assume that exponential growth will last forever, which of course is also not true.
The real story lies somewhere in between. As authors and commentators here on CleanTechnica have pointed out, new technologies often grow via “s-curves,” which begin with a period of exponential growth, followed by linear growth, then exponentially declining growth, before finally settling down to a fixed level. The graph has a characteristic s-shape, as we’ll see below. What do these curves have to say about the transition to EVs? We’ll use them here to explore EV market share growth in Norway, China, Europe, and the US, and also for Tesla.
Before continuing, I should point out that this is a purely mathematical trend analysis; it’s not based on socio-economic factors, which might include government incentives, mineral supplies, new battery chemistries, technical feasibility, cost, etc. That kind of analysis is also important (great example here), so this article is meant to be complementary, not a replacement.
Bare mathematical extrapolation can of course be naïve, especially when data is sparse. But the EV market is beginning to mature, and therefore many of the arguments for and against electric cars are already built into today’s data. Yes, major events can send shockwaves through the system, and we’ve seen real examples of that in the past few years, but it takes real effort to divert the trajectory of major movements. At least in the short term, data can have predictive power.
Let’s start with a simple example. In 2022, Elon Musk announced that Tesla had aspirations to sell 20 million cars per year by 2030. This prediction may have seemed random, as if pulled from an optimistic hat, but the number is in fact a direct extrapolation from Tesla’s historical, exponential growth rate. Here’s a chart of Tesla’s quarterly sales:
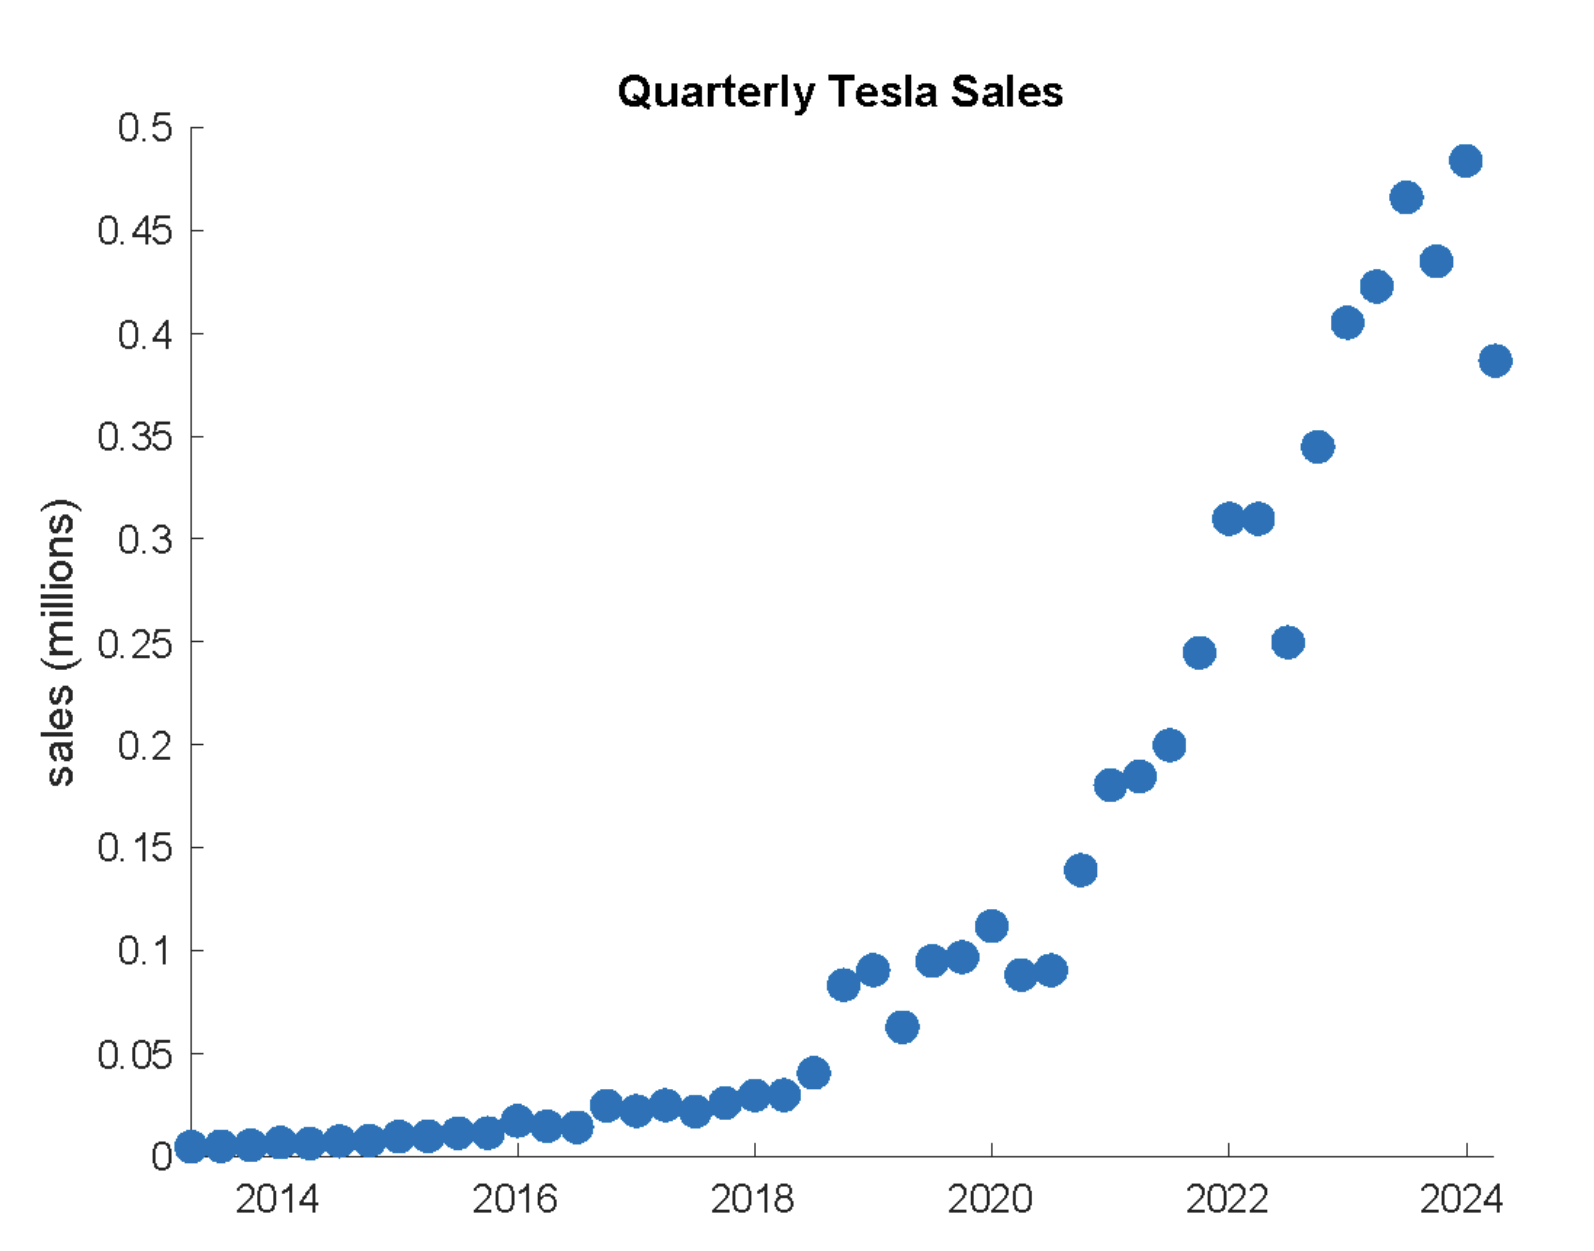
If Tesla’s growth was linear, the curve would look like a straight line, and extrapolating sales out to 2030 would be straightforward. But the growth has been exponential, which makes predictions less obvious. There’s a trick we can use, however, to extrapolate exponential curves. The next chart shows the same data plotted on a logarithmic scale, which turns exponential curves into linear ones. We can now extrapolate future sales by fitting a line to the data (aka, doing linear regression).
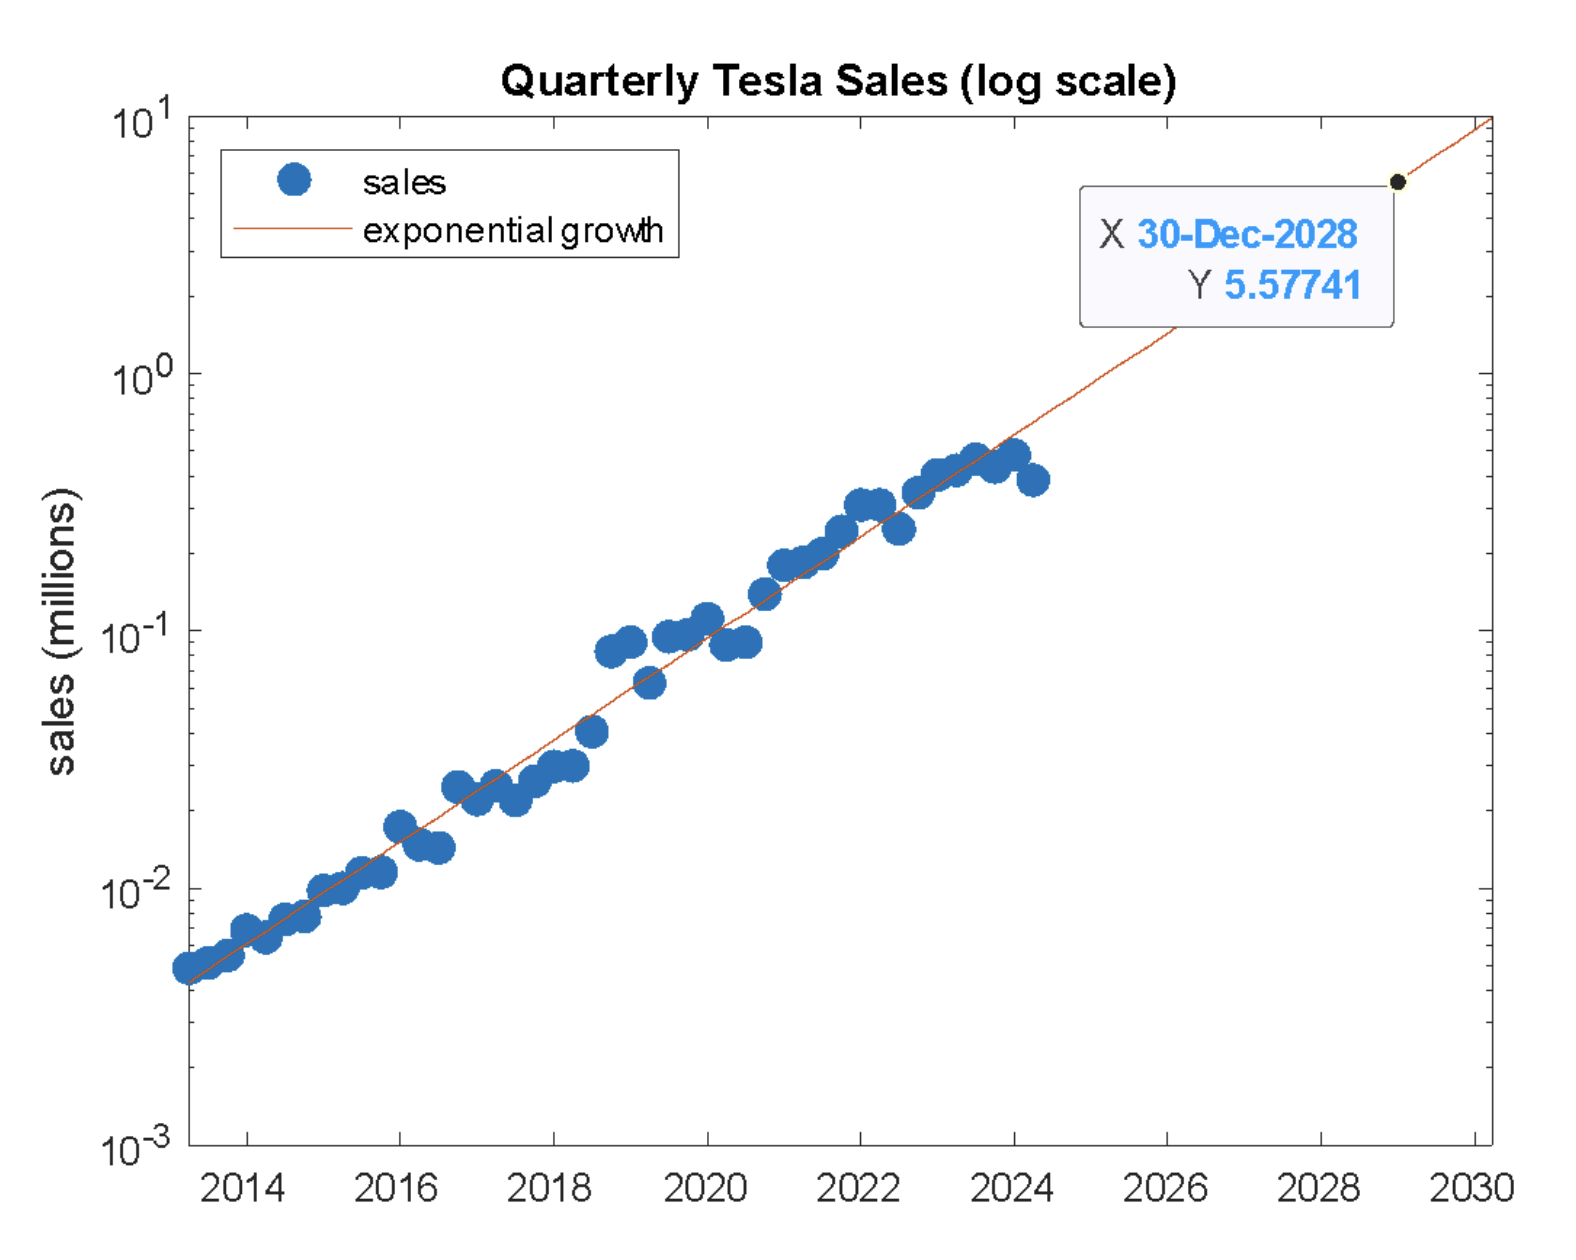
The graph shows that if their current growth rate was to continue, Tesla would exceed 5 million sales per quarter (and thus 20 million sales per year) by 2029, which is right at Elon’s goal of 2030. So, not a random prediction at all.
Will they achieve this? We’ll explore that more below, but for now, suffice it to say that they’d need exponential growth to last from now until then, whereas in practice, exponential growth never lasts forever, as we’ll see in the next example: Norway.
Norway is a mature market for EVs, with market share hovering above 90% (BEV + PHEV). But it didn’t get there through linear growth, nor through endless exponential growth. Here is a plot of Norway’s EV market share, along with a few attempts to model the growth via s-curves (for illustrative purposes):
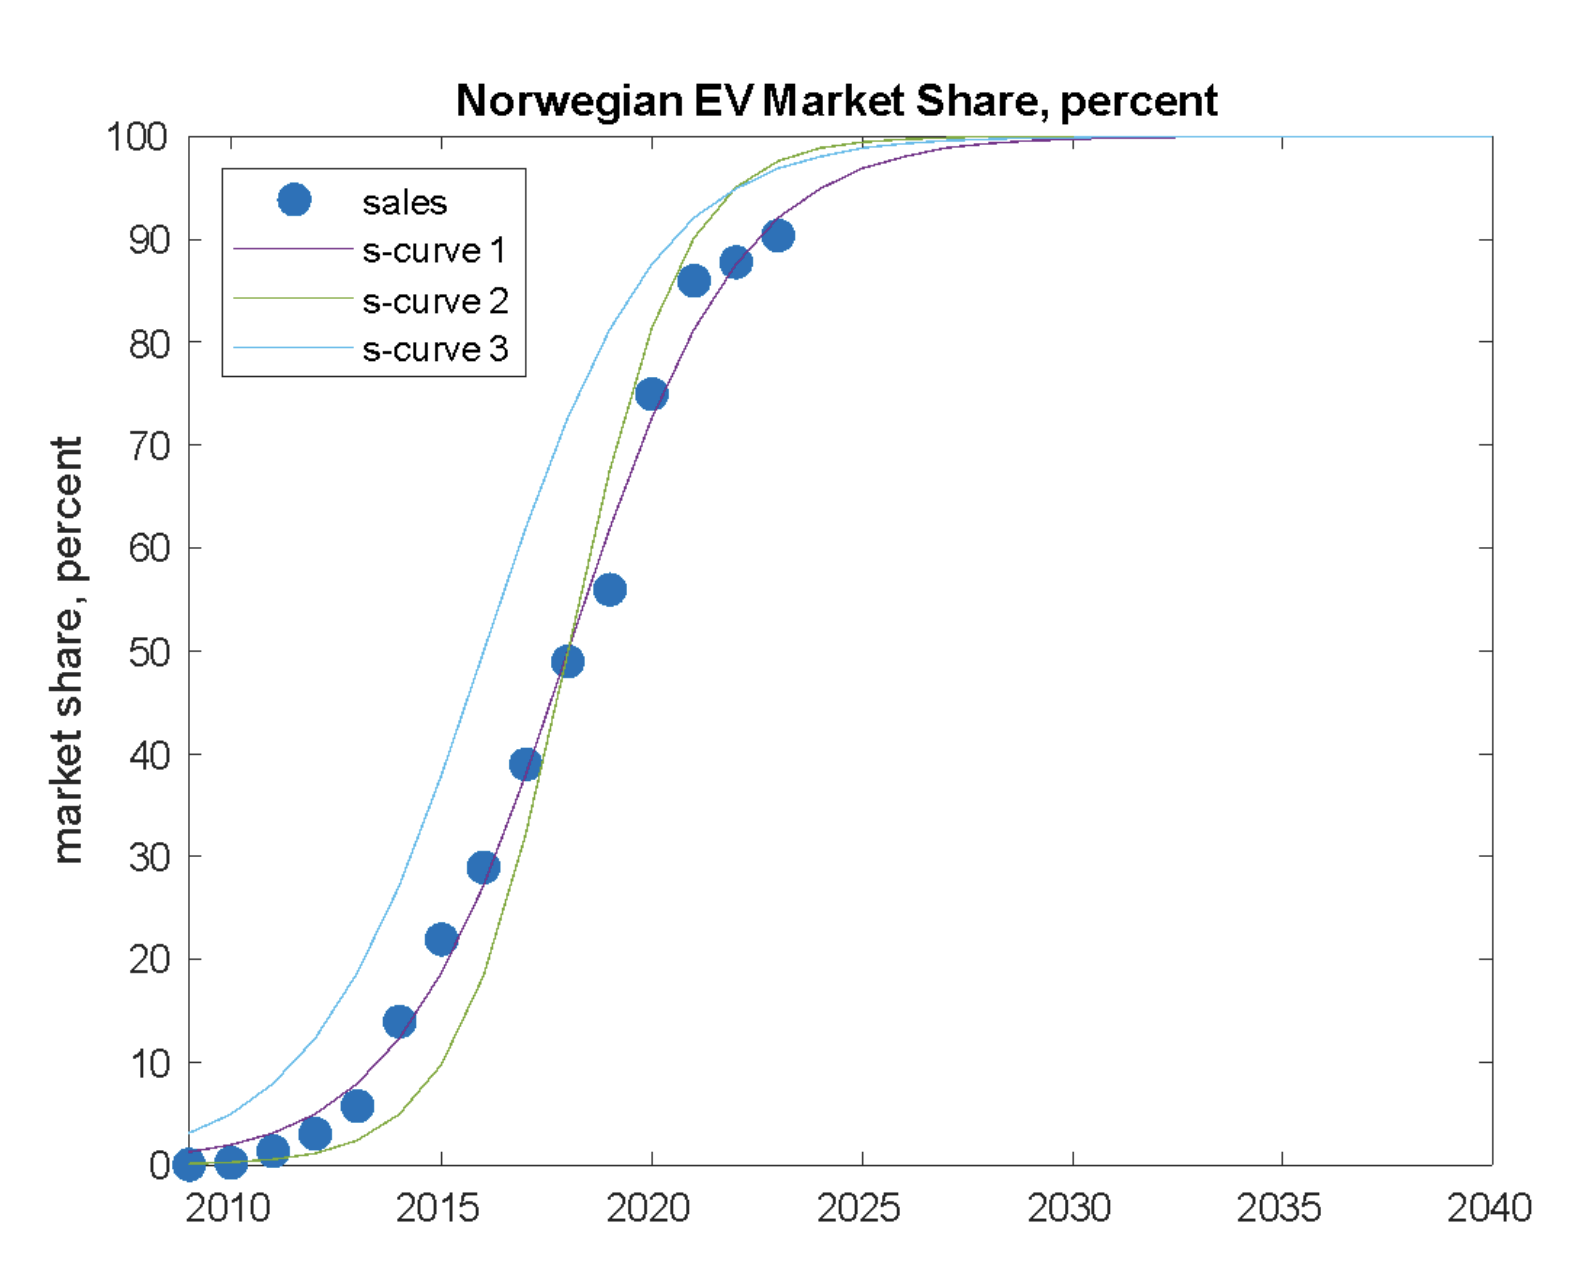
To create s-curve models, we need three things. First, we need to know what the final level is, and here I think we can safely assume that the Norwegian EV market share is headed to 100%, or near enough to it. Second, we need to know how fast the transition happens. And third, we need to know when it happens. We don’t know these second two numbers, but we can try out several guesses and see which curves give the best fit to the sales data. In the Norway plot, the green curve happens at about the right time, but at too fast a rate, the blue curve has the right growth rate but wrong timing, while the purple curve is about right, and has the best fit. For Norway, the s-curve illustrates how the last few percentage points of growth can be as slow as the first few.
Let’s return now to Tesla. Unlike Norway, where the story has already largely played out, fitting an s-curve for Tesla is less certain. We can expect larger error bars. But we can make a reasonable try.
As before, we need to assume a final value for Tesla’s market share. And here, unlike Norway’s EV market share, we don’t know what Tesla’s ultimate share of the market will be. Rather than try and answer that question, we can plot separate s-curves for different values. The next plot tries final values of 5, 10, 15, and 20% market share (assuming 70 million global auto sales per year). For comparison, note that Toyota currently has the largest market share at around 11%.
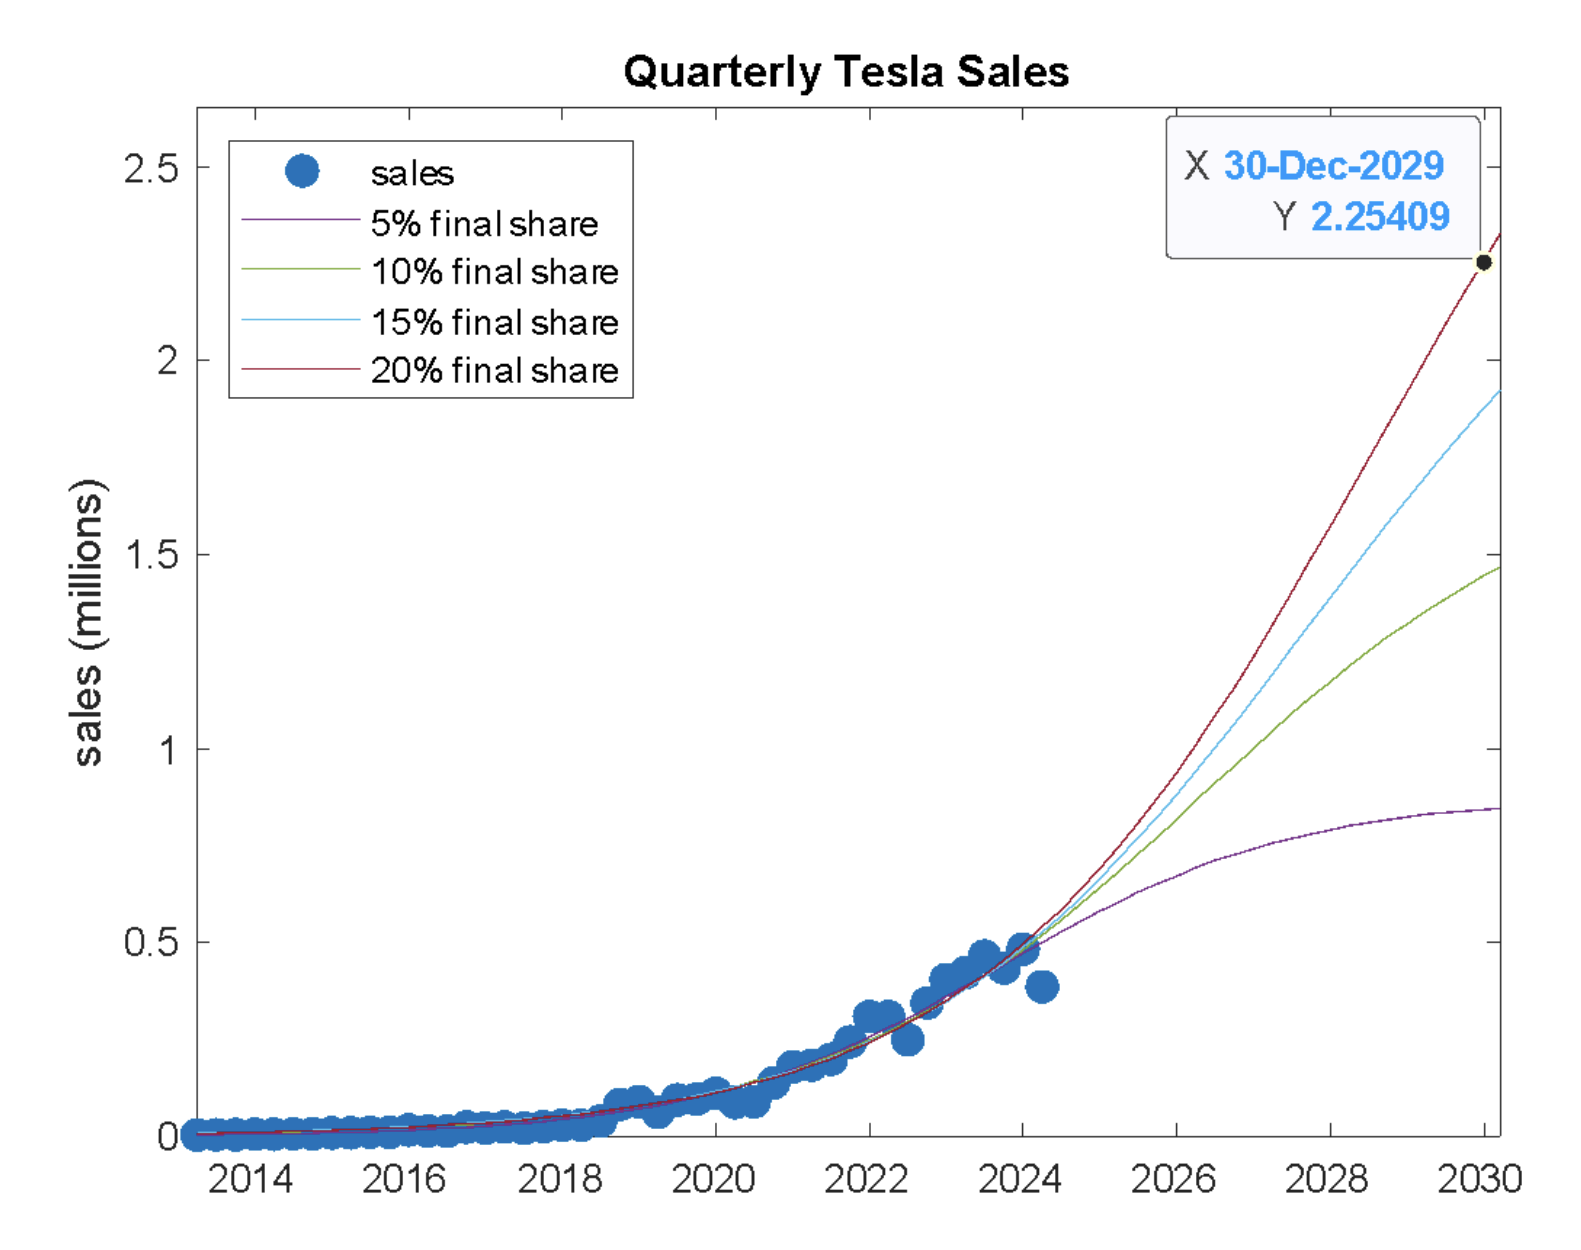
While it is still too early to tell where this curve is going, we can say a couple of things. First, Tesla will almost certainly not reach 20 million sales per year by 2030, because, even if it attains 20% market share (which would be a heroic accomplishment), that trajectory does not get Tesla to 20 million sales, it takes them to less than half that amount (approximately 2.25 million sales per quarter, as marked in the chart). Note that this has nothing to do with last quarter’s disappointing results; if you remove those from the dataset, you’ll get a similar answer.
Second, and on the other hand, if the last quarter was only a blip, then none of these growth curves can be ruled out yet, so Tesla still holds fate in its own hands. Even if the last quarter was a sign of things to come, it’s possible that Tesla has simply entered the linear part of the curve, which means that growth will continue, just not exponentially. That’s not necessarily a failure, as all new companies and products go through this phase eventually.
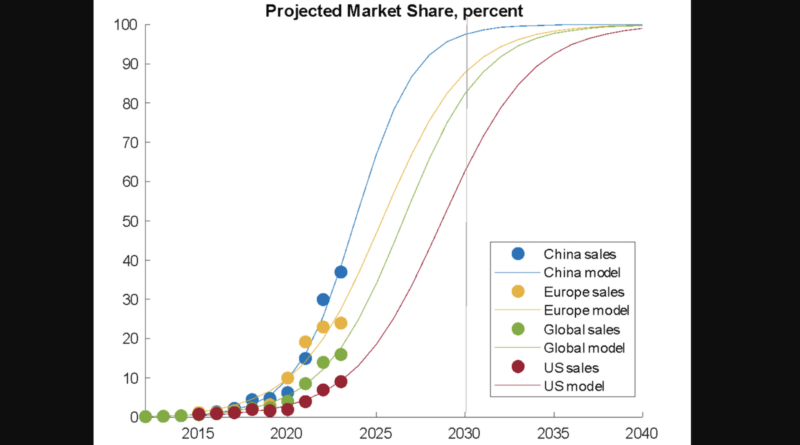
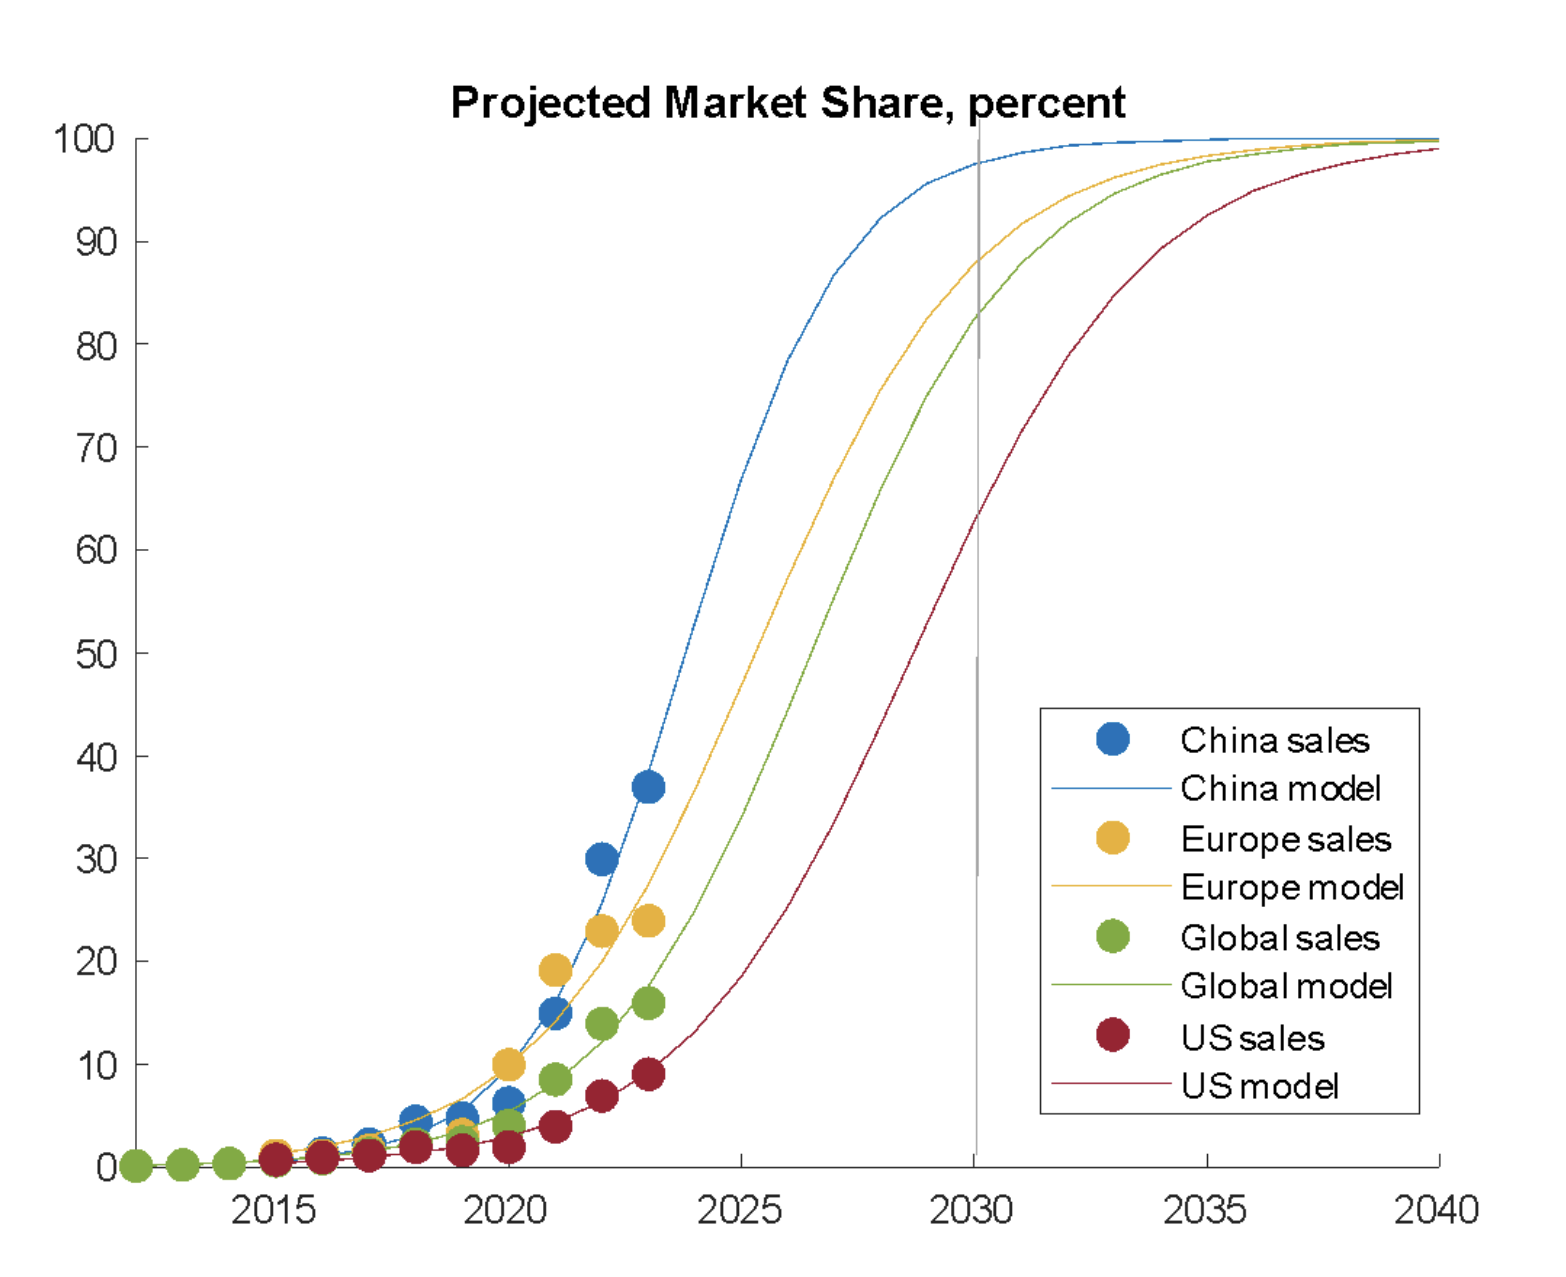
Let’s now look at the bigger picture: EV market share in the US, Europe, China, and the overall global market. Here’s a plot of EV market share for these areas, along with fitted s-curves, assuming that EV market share is headed to 100%. It shows how China is leading the way, knocking on the door of 100% market share by 2030, followed by Europe, which could see 85%, and then the global market at around 80% (heavily influenced by China), while the US lags behind, reaching perhaps only 65% by then.
Of course, absolutely anything can and will happen between now and then. There are short-term concerns for both Tesla and Europe, for example, and these setbacks could turn into longer term trends. Battery supply must continue to expand rapidly. Wars, pandemics, inflation, supply-chain issues, and other economic disruptions could wreak havoc on global markets. Trade policies, especially with regards to China, remain controversial in both the US and Europe. Traditional automakers may continue dragging their feet in the US and Europe. The fossil-fuel industry will continue spreading misinformation. On the other hand, new battery breakthroughs, increased incentives, more models, and cheaper vehicles could accelerate growth.
And, of course, growth rarely follows a perfectly clean s-curve. In practice, curves are always messy. So, of course we can’t call curve-fitting a prediction, but we can call it a reasonable example of what might happen — a default baseline from which numbers may move up or down. Most importantly, how those numbers move up or down in the future is yet to be decided. But there is hope that we’re still moving in the right direction. Where do you think EV sales are headed?
About the author: Dave loves science, enjoys following the transition to clean energy through CleanTechnica, and likes to stay active in the beautiful outdoors of Colorado. David owns a small number of shares in TSLA, VWAGY, and BYD. This article is not meant to offer any investment advice.
Have a tip for CleanTechnica? Want to advertise? Want to suggest a guest for our CleanTech Talk podcast? Contact us here.
Latest CleanTechnica.TV Videos

CleanTechnica uses affiliate links. See our policy here.